


Pandemic put breaks on LNG trade globally, report finds

09 July 2021
Only two countries increased exports--U.S. and Australia
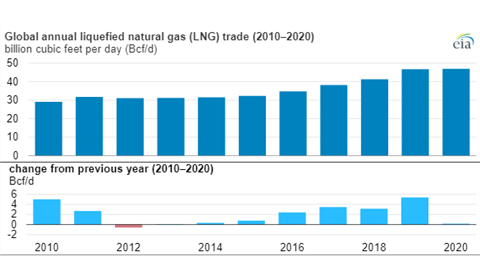
Global trade in liquefied natural gas (LNG) in 2020 remained essentially unchanged from 2019, according to the recently released The LNG Industry: GIIGNL Annual Report 2021 by the International Group of Liquefied Natural Gas Importers (GIIGNL).
The report found trade averaged 46.9 billion cubic feet per day (Bcf/d) in 2020 compared with 46.7 Bcf/d in 2019. This 0.4% annual increase in LNG trade occurred despite the Covid-19 pandemic that reduced global natural gas demand. Between 2015 and 2019, global LNG trade expanded by 45%, posting record growth in both 2018 and 2019. This expansion primarily resulted from liquefaction capacity additions in Australia, the United States, and Russia, which combined accounted for more than 90% of the global growth in liquefaction capacity during this period.
In 2020, LNG exports increased from only two countries—the United States by 1.5 Bcf/d and Australia by 0.3 Bcf/d—compared with 2019. Last year, the United States commissioned several new liquefaction trains, namely the third and final trains at Cameron LNG, Freeport LNG, and Corpus Christi LNG export facilities as well as the remaining trains at the Elba Island LNG export facility. With the spread of the Covid-19 pandemic and lockdowns in many LNG-consuming countries, U.S. LNG exports significantly declined in June and July of 2020, but they have gradually increased in the months that followed and set consecutive all-time highs in November and December 2020.
In 2020, Australia became the world’s largest LNG exporter for the first time, overtaking Qatar, with exports averaging 10.2 Bcf/d, an increase of 0.3 Bcf/d (3%) compared with 2019. Exports from Qatar declined by 0.1 Bcf/d (1%) compared with 2019. Exports from all other countries have either remained flat or declined, amounting to a combined 1.6 Bcf/d decrease compared with 2019.
Among all LNG-importing regions, only Asia had an increase in annual LNG imports, by 1.1 Bcf/d (3%), in 2020 compared with 2019. China and India drove the overall annual increase. China’s LNG imports increased by 1.0 Bcf/d and India by 0.4 Bcf/d in 2020. In China, continuous growth in LNG imports mainly resulted from government-supported coal-to-natural gas switching policies to reduce air pollution. In India, all-time low spot LNG prices in the spring and summer of 2020 led to more fuel switching and an increase in LNG imports procured on a spot basis. LNG imports to Japan continued to decline in 2020, averaging 9.8 Bcf/d, which was 0.3 Bcf/d less than in 2019. Europe’s LNG imports declined by 5%, averaging 10.7 Bcf/d in 2020, but remained significantly higher than the 6.1 Bcf/d in 2017 and 6.4 Bcf/d in 2018.
STAY CONNECTED


Receive the information you need when you need it through our world-leading magazines, newsletters and daily briefings.
CONNECT WITH THE TEAM